packaging planning question
How should finished-goods warehouse capacity be planned?
Warehouse capacity follows daily output by SKU, pallet pattern, stock coverage, aisle method, dispatch rhythm and hold or quarantine policy. Include seasonal peaks and usable locations rather than only floor area.
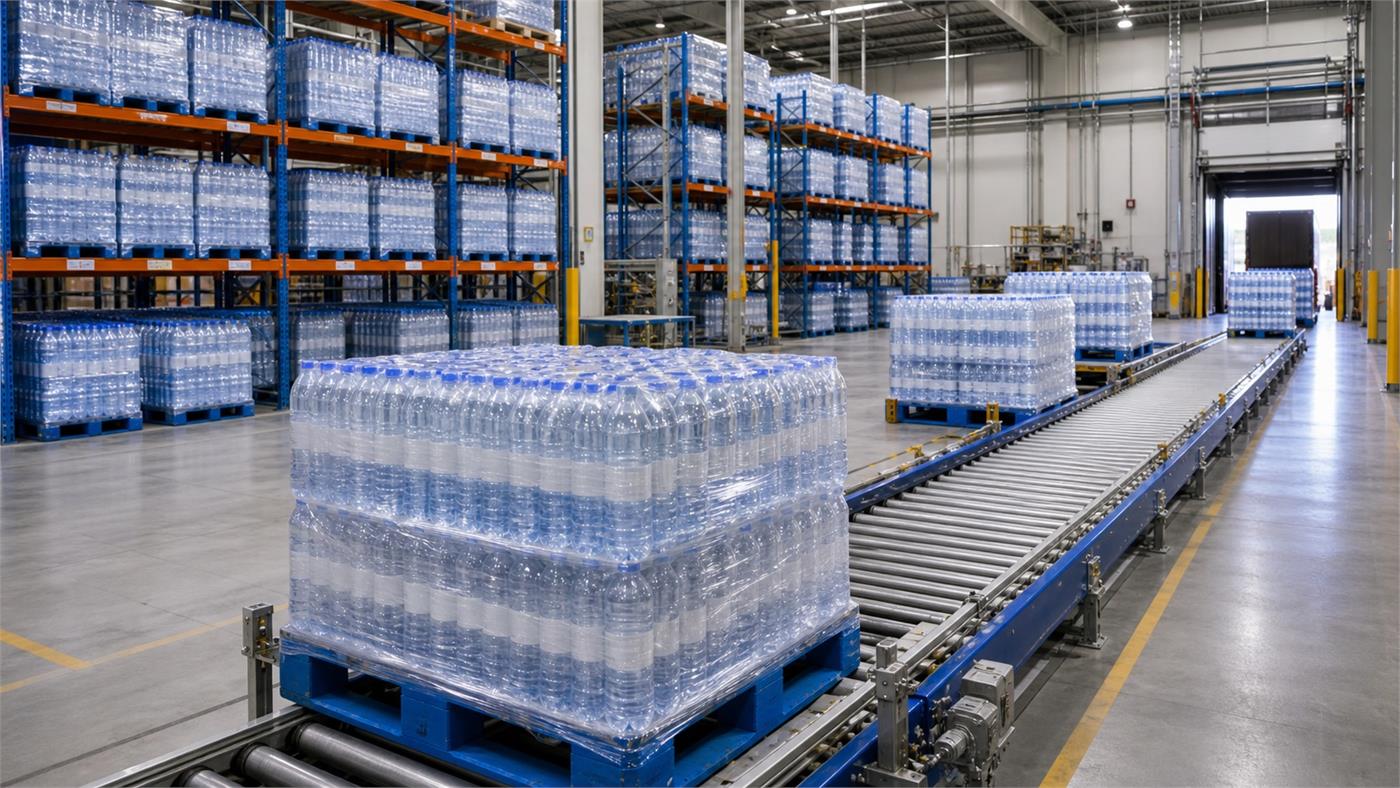
Finished-Goods Warehouse Capacity for Water Plants
Warehouse capacity follows daily output by SKU, pallet pattern, stock coverage, aisle method, dispatch rhythm and hold or quarantine policy. Include seasonal peaks and usable locations rather than only floor area. Use the checklist below to turn the question into a supplier-ready decision without relying on universal figures or unverified claims.
- Daily output by SKU
- Pallet patterns
- Stock coverage
- Dispatch schedule
Decisions Behind Finished-Goods Warehouse Capacity for Water Plants
Define these items against the real product, package, site and production plan before comparing equipment or supplier proposals.
Inventory policy
Define coverage and peak assumptions
SKU slots
Allocate pallet positions by product
Material flow
Separate production, hold and dispatch
Handling system
Match aisles, racks and lift equipment
Finished-Goods Warehouse Capacity for Water Plants Supplier Evidence Matrix
Use the matrix to separate buyer inputs, supplier commitments and evidence that can be checked during design review, FAT, installation or operation.
| Decision | What to define | Evidence to request |
|---|---|---|
| Inventory policy | Define coverage and peak assumptions | Pallet-position calculation |
| SKU slots | Allocate pallet positions by product | SKU inventory model |
| Material flow | Separate production, hold and dispatch | Warehouse flow drawing |
| Handling system | Match aisles, racks and lift equipment | Dispatch and hold procedure |
Project Inputs for Finished-Goods Warehouse Capacity for Water Plants
Incomplete inputs force suppliers to make assumptions. Mark unknown items openly and assign the next action instead of hiding the gap.
Daily output by SKU
Provide current, project-specific information for bottled water warehouse capacity so the supplier can state assumptions and remaining decisions.
Pallet patterns
Provide current, project-specific information for bottled water warehouse capacity so the supplier can state assumptions and remaining decisions.
Stock coverage
Provide current, project-specific information for bottled water warehouse capacity so the supplier can state assumptions and remaining decisions.
Dispatch schedule
Provide current, project-specific information for bottled water warehouse capacity so the supplier can state assumptions and remaining decisions.
FAQ
How should finished-goods warehouse capacity be planned?
Warehouse capacity follows daily output by SKU, pallet pattern, stock coverage, aisle method, dispatch rhythm and hold or quarantine policy. Include seasonal peaks and usable locations rather than only floor area.
Which inputs are needed for bottled water warehouse capacity?
Start with Daily output by SKU, Pallet patterns, Stock coverage, Dispatch schedule. The selected supplier and qualified local specialists must confirm the final project basis.
What evidence should a supplier provide for bottled water warehouse capacity?
Request Pallet-position calculation, SKU inventory model, Warehouse flow drawing, Dispatch and hold procedure. Compare evidence against the same approved product, package, capacity and site conditions.
What is a common mistake when planning bottled water warehouse capacity?
A common mistake is accepting a generic answer without defining the actual bottle, product, output, utilities, interfaces and acceptance method for the project.
How does bottled water warehouse capacity connect to a complete water bottling line?
It affects adjacent equipment, controls, utilities, layout, quality checks or operating responsibilities. Record those interfaces in the complete-line scope and responsibility matrix.
Planning calculator: Finished-water pallet positions
Enter measured or explicitly assumed values. Keep the units and measurement boundary consistent. Compare a second scenario before choosing equipment.
Equation and scope
⌈A × B × C ÷ D ÷ E⌉
- A: Bottle rate [Bottles/h]
- B: Production hours per day [h]
- C: Days held in stock [d]
- D: Bottles per pack [Quantity]
- E: Packs per pallet [Quantity]
⌈x⌉ rounds upward and ⌊x⌋ downward to a whole count. min/max select the lowest/highest sample. ∉ means outside the stated interval.
Convert production held for the chosen days into whole pallet positions. Add aisles, quarantine, dispatch staging, SKU separation and peak demand independently. Positions are not the same as building floor area or usable rack capacity.
Worked example: editable assumptions
Record assumptions separately from measurements. The example numbers demonstrate arithmetic and are not a recommended equipment specification.
| Input or result | Value | Unit |
|---|---|---|
| A — Bottle rate | 6000 | Bottles/h |
| B — Production hours per day | 8 | h |
| C — Days held in stock | 3 | d |
| D — Bottles per pack | 12 | Quantity |
| E — Packs per pallet | 60 | Quantity |
| Pallet positions | 200 | Pallets |
Your project inputs
Calculated result
| Input or result | Value | Unit |
|---|---|---|
| Pallet positions | 200 | Pallets |
This is a planning estimate from the stated inputs, not a machine guarantee or design approval.
Calculation stays in this browser; this worksheet sends no project inputs to the server.
Before procurement, ask the responsible specialist to review the assumptions, drawings and test evidence. A valid calculation does not mean a project has passed acceptance.
Why can an unchanged production rate require many more pallet positions?
These are invented teaching inputs, not equipment ratings, market prices or an accepted tolerance. The two scenarios change one assumption while holding the other inputs constant. Use the comparison to identify what must be measured or agreed for your project.
Read both inputs and outputs in the stated units. The input register explains what evidence to request before substituting your own values. If a source is missing, record the uncertainty rather than silently entering zero or accepting a supplier estimate as a measurement.
Changed assumption: Days held in stock
Input assumptions
| Record item | Unit | Scenario A | Scenario B |
|---|---|---|---|
| Bottle rate | Bottles/h | 7,200 | 7,200 |
| Production hours per day | h | 8 | 8 |
| Days held in stock | d | 2 | 4 |
| Bottles per pack | Quantity | 12 | 12 |
| Packs per pallet | Quantity | 60 | 60 |
Calculated comparison
| Record item | Unit | Scenario A | Scenario B |
|---|---|---|---|
| Pallet positions | Pallets | 160 | 320 |
What the comparison means
The same production rate and operating hours are held for more days before dispatch. Required whole pallet positions increase even though the machinery is unchanged. This stock allowance is not a warehouse floor-area design. Quarantine, staging, SKU separation and access reduce what can actually be stored in the building.
How to establish this input
| Record item | How to establish this input |
|---|---|
| Bottle rate | Record the quantity or distance and the corresponding observation time, named product format and operating mode. Distinguish a measured rate from a quoted capability; an average across a different window is not the same input. |
| Production hours per day | Define the event that starts and finishes this interval and keep its unit explicit. Mark planned time separately from observed elapsed time. Include adjustment, replenishment or release only where the agreed boundary requires it. |
| Days held in stock | Define the event that starts and finishes this interval and keep its unit explicit. Mark planned time separately from observed elapsed time. Include adjustment, replenishment or release only where the agreed boundary requires it. |
| Bottles per pack | Keep the physical count or usable-stock record for the stated configuration and time. Identify incomplete, blocked, rejected or unavailable stock separately. A total installed capacity is not automatically the quantity available in the comparison. |
| Packs per pallet | Keep the physical count or usable-stock record for the stated configuration and time. Identify incomplete, blocked, rejected or unavailable stock separately. A total installed capacity is not automatically the quantity available in the comparison. |
Evidence to request
Use the dispatch calendar, pack and pallet configuration, hold periods and peak stock assumptions. Give the storage planner separate requirements for quarantine, staging and access.
Project decision record
| Record item | Project decision record |
|---|---|
| Input assumptions | Identify the bottle, pack or material configuration, operating mode and measurement boundary. State the start and finish of the observation and which accepted output the comparison represents; unlike boundaries cannot establish a performance improvement. |
| How to establish this input | Mark every input as measured, taken from a drawing, quoted or assumed. Retain the source document identifier, revision, date and responsible person. The same numeral with a different unit or data status is not automatically a comparable input. |
| Project decision record | Ask the responsible supplier and buyer to agree actual acceptance criteria and the evidence that will demonstrate them. Teaching values and calculated outputs on this page do not become approved operating settings or contractual performance guarantees. |
| Evidence to request | Record the decision affected by the result, the measurement or trial still needed, its owner and the next review. Keep unresolved items visible in the handover file instead of changing the figures to make a preferred equipment option appear acceptable. |
Why can available pallet positions be insufficient for the stated production days?
Production time, stock days, bottle format and packs per pallet all affect the arithmetic count, which rounds up to whole positions. Dispatch staging, blocked locations, quarantine and SKU separation remain outside this number. Align the production and inventory time boundaries before converting positions into a warehouse layout.
Which inputs should you verify before using this result?
These are hypothetical sensitivity examples, not measurements from a factory. The lower and higher inputs are chosen for teaching; they are not equipment limits, approved settings, uncertainty intervals or recommended allowances. Whole-count and bounded inputs are adjusted to keep the examples valid, so the changes are not all the same percentage.
Read one input row at a time. For its lower and higher result, only that named input changes; every other input remains at the baseline shown in the first table. Do not combine all the lower columns or all the higher columns into a single operating scenario: those combined conditions have not been calculated here.
Baseline and selected input changes
| Input being changed | Unit | Lower input | Baseline input | Higher input |
|---|---|---|---|---|
| Bottle rate | Bottles/h | 5,760 | 7,200 | 8,640 |
| Production hours per day | h | 6.4 | 8 | 9.6 |
| Days held in stock | d | 1.6 | 2 | 2.4 |
| Bottles per pack | Quantity | 9 | 12 | 15 |
| Packs per pallet | Quantity | 48 | 60 | 72 |
Output when one input changes
| Input being changed | Calculated output | Lower input | Baseline input | Higher input |
|---|---|---|---|---|
| Bottle rate | Pallet positions (Pallets) | 128 | 160 | 192 |
| Production hours per day | Pallet positions (Pallets) | 128 | 160 | 192 |
| Days held in stock | Pallet positions (Pallets) | 128 | 160 | 192 |
| Bottles per pack | Pallet positions (Pallets) | 214 | 160 | 128 |
| Packs per pallet | Pallet positions (Pallets) | 200 | 160 | 134 |
Interpret this problem
A one-input comparison isolates the arithmetic effect inside this model. It does not establish that the input can change independently on a real line. If two quantities share the same measurement, production period or physical constraint, ask the responsible supplier to review that relationship before changing the project basis.
Equal displayed results need interpretation. Whole-item outputs can remain unchanged until a rounding boundary is crossed; displayed decimal values can also hide a small change. Check the stated unit, the underlying counts and the specific explanation below before concluding that an input has no effect.
What to verify next
Use a surprising difference to choose the next measurement, rather than selecting whichever assumption gives the preferred answer. Record the input label and unit, its measured or assumed status, document revision, operating condition and who will verify it. Keep the original record so a later reader can reproduce the comparison.
For a supplier discussion, take the baseline, one changed input, the affected output and the unresolved question together. Agree the field observation or controlled trial that can resolve it and record the responsible person. A mathematical change does not by itself approve equipment capacity, quality acceptance, installation or a purchase decision.
Where do the inputs come from, and which result do they change?
Mark each project value as measured, quoted, taken from a drawing, assumed or awaiting confirmation. Early estimates can use stated assumptions; a missing value is not zero. The calculator defaults are illustrative, not evidence about your plant.
| Input or result / Unit | Evidence to request | Substitution to avoid |
|---|---|---|
| Bottle rate (Bottles/h) | Identify the counted bottle boundary and the exact observation interval. Retain opening and closing counter readings, accepted quantity and operating mode so the hourly rate can be reproduced. | A machine nameplate rate, instantaneous display and accepted output over a shift are different records. Do not substitute one for another without stating the change of basis. |
| Production hours per day (h) | Document the production hours represented in a day, including how planned stops and non-production periods are handled in the inventory calculation. | Scheduled shift hours and productive hours can differ. Do not combine a rate measured over running time with calendar hours without explaining the basis. |
| Days held in stock (d) | State the stock-holding period and the production or dispatch assumption it represents. Identify whether it is average cover, peak cover or a scenario. | Calendar days and operating days are different bases. A chosen number of days does not include quarantine, staging or SKU separation by itself. |
| Bottles per pack (Quantity) | Confirm the number of bottles in one completed pack for the exact format being evaluated. Retain the pack specification and treatment of incomplete packs. | A tray count, carton count and bottle count are different units. A format change must be reflected consistently in throughput, mass and warehouse calculations. |
| Packs per pallet (Quantity) | Confirm complete packs on one usable pallet for the selected pack format and stacking pattern. Retain the supporting layer and pallet configuration. | A pallet capacity for a different bottle or pack cannot be transferred without review. Keep partial pallets and special storage arrangements visible. |
Input-to-result trace
The links below trace each input to the equations that use it. They describe mathematical dependence, not every shared input-validation rule. Retain the source, revision, operating condition and person responsible for each value before comparing offers.
Bottle rate (Bottles/h) → Pallet positions (Pallets)
Production hours per day (h) → Pallet positions (Pallets)
Days held in stock (d) → Pallet positions (Pallets)
Bottles per pack (Quantity) → Pallet positions (Pallets)
Packs per pallet (Quantity) → Pallet positions (Pallets)
Equations and unit basis
Use the numerical input values in the units shown here. Conversion factors belong to these units. Compare the equation with the calculator result and the example before transferring it to another unit system.
Pallet positions (Pallets)
Pallet positions (Pallets) = ceil(((((Bottle rate × Production hours per day) × Days held in stock) ÷ Bottles per pack) ÷ Packs per pallet))
Inputs used in this result: Bottles per pack (Quantity); Bottle rate (Bottles/h); Days held in stock (d); Production hours per day (h); Packs per pallet (Quantity).
ceil rounds up to a whole count; floor rounds down. min and max select the smallest and largest values. I(P) is 1 when condition P is true, otherwise 0; ∨ means “or”. π is the circle constant. Semicolons separate function arguments.
These relations explain the planning model. A mathematical result does not set acceptance limits, approve a machine setting or establish legal filling tolerances. Keep project approval and evidence separate from arithmetic.
Production hours per day + Days held in stock: What happens when two planning inputs change together?
Compare four explicitly hypothetical combinations. Only the two named inputs vary; every other input remains fixed. These examples complete the corner cases around the single-input comparisons above. They are teaching assumptions, not measured plant data, recommended settings, approved limits or probability ranges.
Read A as lower/lower, B as lower/higher, C as higher/lower and D as higher/higher, in the displayed input order. A is the comparison origin, not the original project baseline. The two factors are varied independently for this calculation; that does not prove every combination is physically feasible.
Whole-count rounding can hide a small arithmetic change or create a one-item jump. Inspect the unrounded operation before treating equal displayed counts as equal engineering conditions.
Calculated results across the four cases
| Calculated result | A | B | C | D |
|---|---|---|---|---|
| Pallet positions (Pallets) | 103 | 154 | 154 | 231 |
Separate and combined changes from A
| Calculated result | Input or result | Calculated value |
|---|---|---|
| Pallet positions (Pallets) | First input alone: C − A | 51 |
| Pallet positions (Pallets) | Second input alone: B − A | 51 |
| Pallet positions (Pallets) | Both inputs: D − A | 128 |
| Pallet positions (Pallets) | Sum of the two separate changes | 102 |
| Pallet positions (Pallets) | Combined change minus that sum | 26 |
The last difference is D − C − B + A, in the output unit. Zero means the four computed values are additive at these selected points; it does not prove independence in a real line. A nonzero difference can follow from multiplication, division or whole-count rounding. It is not a measured machine interaction or a statistical confidence interval.
Hypothetical combination A: Production hours per day = 6.4 h; Days held in stock = 1.6 d
Complete inputs for reproducing this case
| Input or result | Calculated value | Unit |
|---|---|---|
| Bottle rate | 7200 | Bottles/h |
| Production hours per day | 6.4 | h |
| Days held in stock | 1.6 | d |
| Bottles per pack | 12 | Quantity |
| Packs per pallet | 60 | Quantity |
Step-by-step substitution from the stated inputs
Intermediate values display up to six decimal places; calculations retain unrounded values. Reproduce operations from the original inputs. Intermediate numbers do not necessarily have the final result unit. π and whole-count functions follow the model reference. CSV numbers use a decimal point.
Pallet positions (Pallets)
| Input or result | Operation | Calculated value |
|---|---|---|
| 1 | (7200 × 6.4) | 46080 |
| 2 | ((7200 × 6.4) × 1.6) | 73728 |
| 3 | (((7200 × 6.4) × 1.6) ÷ 12) | 6144 |
| 4 | ((((7200 × 6.4) × 1.6) ÷ 12) ÷ 60) | 102.4 |
| 5 | ceil((((([Bottle rate: 7200 Bottles/h] × [Production hours per day: 6.4 h]) × [Days held in stock: 1.6 d]) ÷ [Bottles per pack: 12 Quantity]) ÷ [Packs per pallet: 60 Quantity])) ceil(((((7200 × 6.4) × 1.6) ÷ 12) ÷ 60)) | 103 |
Hypothetical combination B: Production hours per day = 6.4 h; Days held in stock = 2.4 d
Complete inputs for reproducing this case
| Input or result | Calculated value | Unit |
|---|---|---|
| Bottle rate | 7200 | Bottles/h |
| Production hours per day | 6.4 | h |
| Days held in stock | 2.4 | d |
| Bottles per pack | 12 | Quantity |
| Packs per pallet | 60 | Quantity |
Step-by-step substitution from the stated inputs
Intermediate values display up to six decimal places; calculations retain unrounded values. Reproduce operations from the original inputs. Intermediate numbers do not necessarily have the final result unit. π and whole-count functions follow the model reference. CSV numbers use a decimal point.
Pallet positions (Pallets)
| Input or result | Operation | Calculated value |
|---|---|---|
| 1 | (7200 × 6.4) | 46080 |
| 2 | ((7200 × 6.4) × 2.4) | 110592 |
| 3 | (((7200 × 6.4) × 2.4) ÷ 12) | 9216 |
| 4 | ((((7200 × 6.4) × 2.4) ÷ 12) ÷ 60) | 153.6 |
| 5 | ceil((((([Bottle rate: 7200 Bottles/h] × [Production hours per day: 6.4 h]) × [Days held in stock: 2.4 d]) ÷ [Bottles per pack: 12 Quantity]) ÷ [Packs per pallet: 60 Quantity])) ceil(((((7200 × 6.4) × 2.4) ÷ 12) ÷ 60)) | 154 |
Hypothetical combination C: Production hours per day = 9.6 h; Days held in stock = 1.6 d
Complete inputs for reproducing this case
| Input or result | Calculated value | Unit |
|---|---|---|
| Bottle rate | 7200 | Bottles/h |
| Production hours per day | 9.6 | h |
| Days held in stock | 1.6 | d |
| Bottles per pack | 12 | Quantity |
| Packs per pallet | 60 | Quantity |
Step-by-step substitution from the stated inputs
Intermediate values display up to six decimal places; calculations retain unrounded values. Reproduce operations from the original inputs. Intermediate numbers do not necessarily have the final result unit. π and whole-count functions follow the model reference. CSV numbers use a decimal point.
Pallet positions (Pallets)
| Input or result | Operation | Calculated value |
|---|---|---|
| 1 | (7200 × 9.6) | 69120 |
| 2 | ((7200 × 9.6) × 1.6) | 110592 |
| 3 | (((7200 × 9.6) × 1.6) ÷ 12) | 9216 |
| 4 | ((((7200 × 9.6) × 1.6) ÷ 12) ÷ 60) | 153.6 |
| 5 | ceil((((([Bottle rate: 7200 Bottles/h] × [Production hours per day: 9.6 h]) × [Days held in stock: 1.6 d]) ÷ [Bottles per pack: 12 Quantity]) ÷ [Packs per pallet: 60 Quantity])) ceil(((((7200 × 9.6) × 1.6) ÷ 12) ÷ 60)) | 154 |
Hypothetical combination D: Production hours per day = 9.6 h; Days held in stock = 2.4 d
Complete inputs for reproducing this case
| Input or result | Calculated value | Unit |
|---|---|---|
| Bottle rate | 7200 | Bottles/h |
| Production hours per day | 9.6 | h |
| Days held in stock | 2.4 | d |
| Bottles per pack | 12 | Quantity |
| Packs per pallet | 60 | Quantity |
Step-by-step substitution from the stated inputs
Intermediate values display up to six decimal places; calculations retain unrounded values. Reproduce operations from the original inputs. Intermediate numbers do not necessarily have the final result unit. π and whole-count functions follow the model reference. CSV numbers use a decimal point.
Pallet positions (Pallets)
| Input or result | Operation | Calculated value |
|---|---|---|
| 1 | (7200 × 9.6) | 69120 |
| 2 | ((7200 × 9.6) × 2.4) | 165888 |
| 3 | (((7200 × 9.6) × 2.4) ÷ 12) | 13824 |
| 4 | ((((7200 × 9.6) × 2.4) ÷ 12) ÷ 60) | 230.4 |
| 5 | ceil((((([Bottle rate: 7200 Bottles/h] × [Production hours per day: 9.6 h]) × [Days held in stock: 2.4 d]) ÷ [Bottles per pack: 12 Quantity]) ÷ [Packs per pallet: 60 Quantity])) ceil(((((7200 × 9.6) × 2.4) ÷ 12) ÷ 60)) | 231 |
Use a differing result to identify the joint operating condition that needs evidence. Ask the supplier to check the combination, fixed assumptions and relevant approval before changing equipment. These calculations do not establish acceptance, safe operating ranges or a guaranteed output.
Choose the next planning task
Translate bottle flow into packs, pallet loads and stock positions. Check each format and dispatch pattern before sizing the downstream equipment.
Connect this task to the complete line plan
Related planning guides
Request a Finished-Goods Warehouse Capacity for Water Plants Scope Review
Share what you know now. The goal is to prepare a useful plant brief before a machine quotation is built.